Aucun calcul pour l'instant
Aucun favori pour l'instant
Indice de Conversion
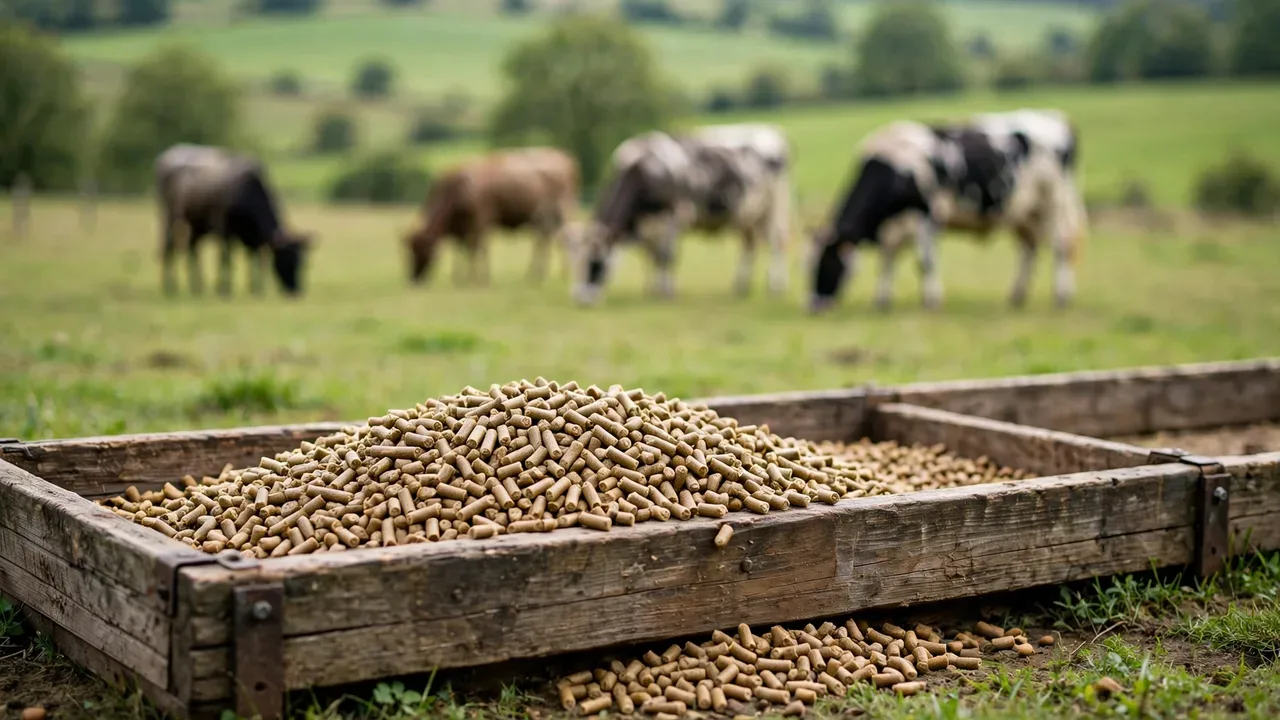
Calculer FCR (feed conversion ratio), feed efficiency, and profitability analysis for livestock and aquaculture.
Résultats
Comment Utiliser Cette Calculatrice
Entrez les valeurs requises dans les champs du formulaire. Chaque champ inclut des valeurs par défaut ajustables. Cliquez sur Calculer pour des résultats instantanés. Utilisez le bouton Métrique/Impérial pour basculer. Les résultats s'affichent dans le panneau pour la planification agricole.
À Propos de Cet Outil
La Fcr aide les agriculteurs, agronomes et étudiants à effectuer des calculs rapides et précis pour la gestion de l'exploitation. Elle utilise des formules agricoles standard basées sur les recommandations de vulgarisation et la littérature scientifique.
Applicabilité: Ce calculateur est conçu pour l'élevage en Afrique francophone, avec une pertinence particulière pour la Côte d'Ivoire, le Sénégal et le Cameroun.
Comment Fonctionne le Calcul
Cette calculatrice utilise des formules agricoles établies. La méthodologie suit les pratiques recommandées par les services de vulgarisation et les institutions de recherche. Toutes les formules sont transparentes et vérifiables. Elle tient compte des facteurs d'efficacité et des pertes.
Exemple Pratique
Un agriculteur utilise cette calculatrice pour planifier fcr dans son exploitation. En entrant des données spécifiques, il reçoit des calculs instantanés pour des décisions éclairées. Les résultats permettent de comparer des scénarios, d'optimiser les intrants et d'estimer les résultats.
Conseils et Erreurs Courantes
Erreurs courantes : unités incorrectes, données estimées plutôt que mesurées, ignorance des conditions locales, surinterprétation. Pour de meilleurs résultats : utilisez des entrées précises, comprenez les hypothèses, vérifiez par l'expérience, consultez des experts et utilisez l'analyse de scénarios.
Révisé par l'Équipe Éditoriale d'Agricalc — Ingénieurs agricoles et agronomes avec plus de 10 ans d'expérience sur le terrain. Notre équipe vérifie chaque formule contre des publications de vulgarisation révisées par des pairs. Pour des conseils spécifiques, consultez votre agronome local.
Références
- FAO — Livestock Production and Health
- USDA — Livestock and Animal Industry
- Penn State Extension — Dairy and Livestock
Questions Fréquemment Posées
What is the optimal Fcr for different livestock species?
Optimal Fcr varies by species and stage: cattle growing calves gain 0.8-1.2 kg/day, mature cows maintain at 2% body weight DM/day; pigs grow 0.7-0.9 kg/day with FCR 2.5-3.0; poultry broilers reach 2 kg in 5-6 weeks with FCR 1.6-1.9; sheep lambs gain 0.2-0.3 kg/day. Genetics, nutrition, health, and environment all influence performance. Regular weighing and record-keeping identify underperforming animals. Consult NRC (National Research Council) publications for species-specific nutrient requirements at each production stage.
How do nutrition and Fcr relate?
Nutrition is the primary driver of Fcr. Energy fuels maintenance and growth; protein builds muscle and supports reproduction; minerals/vitamins are essential for bone, immune function, and metabolism. Deficiencies limit growth even with adequate energy. Cattle on low-protein forage (<7% CP) cannot digest fiber efficiently, reducing intake and gain. Ration balancing using forage analysis and NRC standards optimizes Fcr while minimizing feed costs. For ruminants, forage quality determines intake potential — high-quality forage supports higher intake and gain.
What health issues affect Fcr?
Health issues reducing Fcr: internal parasites (reduce nutrient absorption 10-30%), respiratory disease (shipping fever costs $50-100+/animal), digestive disorders (acidosis on high-grain diets), lameness (reduces feed intake), reproductive failures, metabolic diseases (milk fever, ketosis). Prevention through vaccination, parasite control, proper nutrition, biosecurity, and stress reduction is far more cost-effective than treatment. Regular health monitoring and prompt veterinary intervention minimize production losses. A good health program returns $3-5 for every $1 invested.
How do I measure and track Fcr?
Measure Fcr by: regular weighing (cattle every 30-60 days, pigs every 2-4 weeks), using calibrated scales or weight tapes (cattle heart girth estimates weight within 5-10%), recording group/individual weights, calculating ADG = (final − initial) ÷ days, tracking feed intake for FCR = feed ÷ gain, maintaining records in spreadsheets or herd software. Compare actual performance against breed standards and historical data to identify problems early. For pasture cattle, use periodic weight checks to evaluate forage quality and stocking rate.
What environmental factors influence Fcr?
Environmental factors: temperature (heat stress above 25-30°C reduces feed intake 10-30%; cold stress increases energy needs), humidity (exacerbates heat stress), ventilation (poor air quality causes respiratory disease), stocking density (overcrowding increases stress, aggression, disease), lighting (proper cycles improve poultry growth/reproduction), water quality (clean water essential — intake correlates with feed intake). THI >72 indicates mild heat stress in cattle, >78 severe. Provide shade, fans, sprinklers, windbreaks, and clean water to maximize genetic potential for growth.