Aucun calcul pour l'instant
Aucun favori pour l'instant
Peuplement Aquacole
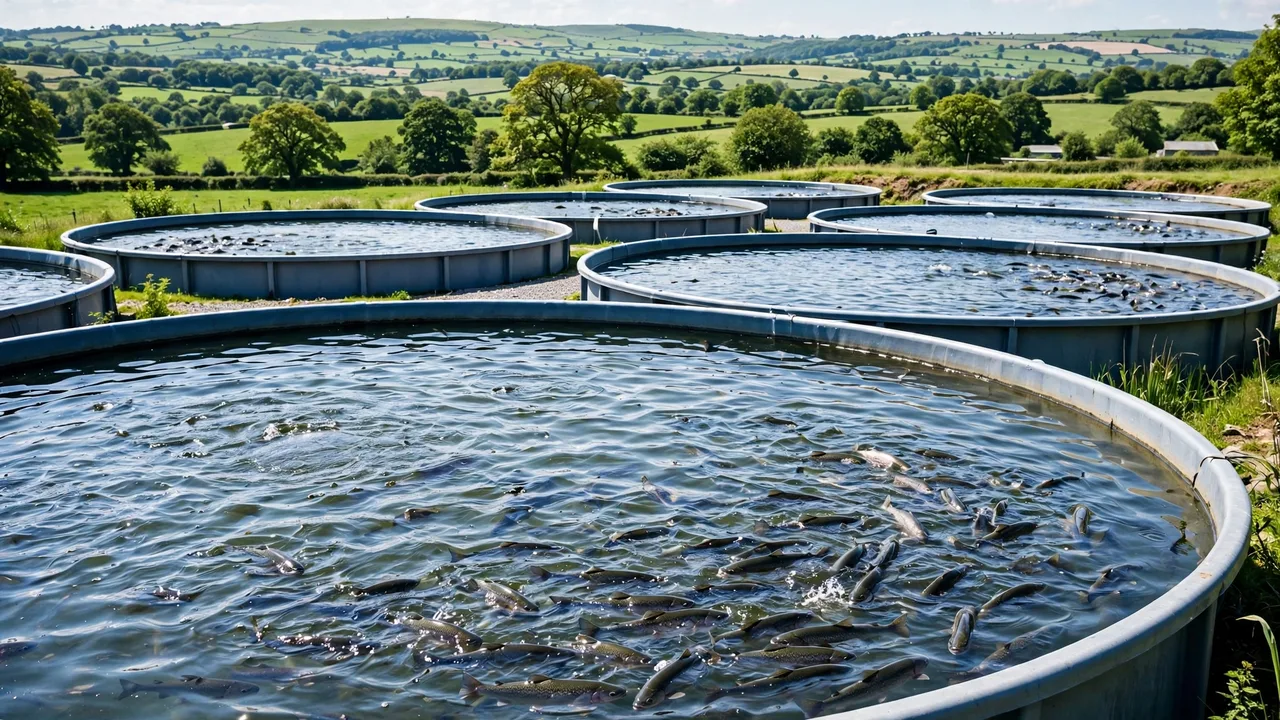
Calculer fish/shrimp stocking density, total seed requirement, and daily feed amount for pond and cage aquaculture.
Résultats
Comment Utiliser Cette Calculatrice
Entrez les valeurs requises dans les champs du formulaire. Chaque champ inclut des valeurs par défaut ajustables. Cliquez sur Calculer pour des résultats instantanés. Utilisez le bouton Métrique/Impérial pour basculer. Les résultats s'affichent dans le panneau pour la planification agricole.
À Propos de Cet Outil
La Aquaculture Stocking aide les agriculteurs, agronomes et étudiants à effectuer des calculs rapides et précis pour la gestion de l'exploitation. Elle utilise des formules agricoles standard basées sur les recommandations de vulgarisation et la littérature scientifique.
Applicabilité: Ce calculateur est conçu pour l'élevage en Afrique francophone, avec une pertinence particulière pour la Côte d'Ivoire, le Sénégal et le Cameroun.
Comment Fonctionne le Calcul
Cette calculatrice utilise des formules agricoles établies. La méthodologie suit les pratiques recommandées par les services de vulgarisation et les institutions de recherche. Toutes les formules sont transparentes et vérifiables. Elle tient compte des facteurs d'efficacité et des pertes.
Exemple Pratique
Un agriculteur utilise cette calculatrice pour planifier aquaculture stocking dans son exploitation. En entrant des données spécifiques, il reçoit des calculs instantanés pour des décisions éclairées. Les résultats permettent de comparer des scénarios, d'optimiser les intrants et d'estimer les résultats.
Conseils et Erreurs Courantes
Erreurs courantes : unités incorrectes, données estimées plutôt que mesurées, ignorance des conditions locales, surinterprétation. Pour de meilleurs résultats : utilisez des entrées précises, comprenez les hypothèses, vérifiez par l'expérience, consultez des experts et utilisez l'analyse de scénarios.
Révisé par l'Équipe Éditoriale d'Agricalc — Ingénieurs agricoles et agronomes avec plus de 10 ans d'expérience sur le terrain. Notre équipe vérifie chaque formule contre des publications de vulgarisation révisées par des pairs. Pour des conseils spécifiques, consultez votre agronome local.
Références
Questions Fréquemment Posées
What is the recommended stocking density for Aquaculture Stocking?
Stocking density depends on species, system type, and aeration: static ponds with aeration — tilapia 3-5 fish/m³, catfish 1-2 fish/m³, trout 5-10 kg/m³; without aeration reduce by 50-70%; recirculating aquaculture systems (RAS) — 20-50 kg/m³ with excellent water quality management; cage culture — 10-30 kg/m³. Start conservative and increase as you gain experience. Overstocking causes: reduced growth, increased disease, poor water quality (low oxygen, high ammonia), higher mortality. Always base density on carrying capacity = water volume × max biomass density, and monitor water quality daily.
How do I calculate feed requirements for Aquaculture Stocking?
Calculate feed requirements: (1) Estimate biomass = number of fish × average weight, (2) Determine daily feed rate = biomass × feeding rate (1-5% body weight/day for growing fish, 0.5-1% for maintenance), (3) Account for feed conversion ratio (FCR: tilapia 1.5-2.0, catfish 1.8-2.5, trout 1.0-1.5), (4) Total feed for grow-out = total weight gain × FCR. For example: 1,000 tilapia at 50 g = 50 kg biomass, feeding at 3% = 1.5 kg/day. Feed represents 50-70% of aquaculture production costs. Use floating pellets for easy observation, feed at consistent times, and remove uneaten feed to maintain water quality.
What water quality parameters are critical for Aquaculture Stocking?
Critical water quality parameters: dissolved oxygen (minimum 5 mg/L for most species, below 3 mg/L causes stress/death — aerate when <5), temperature (species-specific: tilapia 25-30°C, trout 10-18°C, catfish 25-30°C), pH (6.5-8.5 optimal, below 5.5 or above 9.0 causes stress), ammonia (total ammonia <1 mg/L, unionized ammonia <0.02 mg/L — toxic), nitrite (<0.5 mg/L), alkalinity (50-200 mg/L as CaCO3 for stability). Test daily during critical periods. Poor water quality is the #1 cause of fish kills in aquaculture. Invest in a good test kit and aeration backup system.
How do I prevent disease in Aquaculture Stocking?
Disease prevention in Aquaculture Stocking: biosecurity (source disease-free fingerlings, disinfect equipment, limit visitor access, footbaths), water quality management (the best disease prevention — stress from poor water suppresses immune function), stocking density (avoid overcrowding), nutrition (balanced diet with vitamins/minerals supports immunity), regular health monitoring (observe behavior, appetite, external signs), quarantine new stock for 2-4 weeks, vaccination where available, and prompt treatment when disease appears. Common diseases: bacterial (columnaris, aeromonas), parasitic (ich, anchor worm), fungal (saprolegnia). Early intervention reduces mortality and treatment cost.
What is the economic viability of Aquaculture Stocking?
Aquaculture Stocking economic viability depends on: species choice (tilapia and catfish have established markets and proven technology), system type (ponds are lowest capital cost, RAS has highest production but highest capital/operating costs), scale (larger operations benefit from economies of scale — minimum 5,000-10,000 fish/year for profitability), market access (direct sales to restaurants/retail get $3-6/kg vs $1.5-2.5/kg wholesale), and production efficiency (FCR, survival rate, growth rate). Typical investment: pond system $10,000-50,000, RAS $50,000-500,000+. Payback period 3-7 years with good management. Start small, learn the biology, then scale.