Farm Carbon Footprint
Estimate greenhouse gas emissions from your farm operations and identify reduction opportunities.
Results
How to Use This Calculator
Enter the required input values in the form fields above. Each field includes default values you can adjust. Click Calculate to see instant results. Use the Metric/Imperial toggle to switch unit systems. Results are displayed in the results panel for farm planning.
About This Tool
The Carbon Footprint helps farmers, agronomists, and agricultural students make quick, accurate calculations for farm management. This tool uses standard agricultural formulas based on extension service recommendations and scientific literature.
Applicability: Useful for general farm management across diverse agricultural regions worldwide.
How the Calculation Works
This calculator uses established agricultural formulas to compute results from your input values. The methodology follows standard practices recommended by agricultural extension services and research institutions. All formulas are transparent and verifiable against published literature. The calculator accounts for standard efficiency factors and loss rates where applicable.
Real-World Example
A farmer uses this calculator to plan carbon footprint for their operation. By entering specific field data, they receive instant calculations that support informed management decisions. The results allow comparing scenarios, optimizing inputs, and estimating outcomes before committing resources.
Common Mistakes & Tips
Common mistakes include using incorrect units (always verify metric vs imperial), entering estimated rather than measured data, ignoring local conditions and extension recommendations, and over-interpreting results. For best results: use accurate measured inputs, understand formula assumptions, verify results against experience, consult local experts for critical decisions, and use scenario analysis.
Reviewed by Agricalc Editorial Team — Agricultural engineers and agronomists with 10+ years of field experience. Our team verifies every calculator formula against peer-reviewed extension publications. For site-specific advice, consult your local agronomist.
References
- USDA — Climate Smart Agriculture
- FAO — Climate Change and Food Security
- IPCC — 2019 Refinement to GHG Guidelines
Frequently Asked Questions
How do I calculate my farm's Carbon Footprint?
Calculate farm Carbon Footprint by summing emissions from all sources: livestock enteric fermentation (cattle produce 100-200 kg CH4/head/year), manure management (CH4 and N2O from storage), fertilizer application (1-2% of applied N becomes N2O — 1 kg N2O = 298 kg CO2e), fuel combustion (diesel 2.68 kg CO2/L, gasoline 2.32 kg CO2/L), electricity use (0.4-0.8 kg CO2/kWh depending on grid), and land use change. Use GHG Protocol or IPCC guidelines. Carbon sequestration from soil (cover crops, no-till can sequester 0.2-2 t CO2e/ha/year) and trees offsets emissions. Net footprint = total emissions − sequestration. Many farms can reduce footprint 20-40% through improved management.
What are the biggest sources of Carbon Footprint in agriculture?
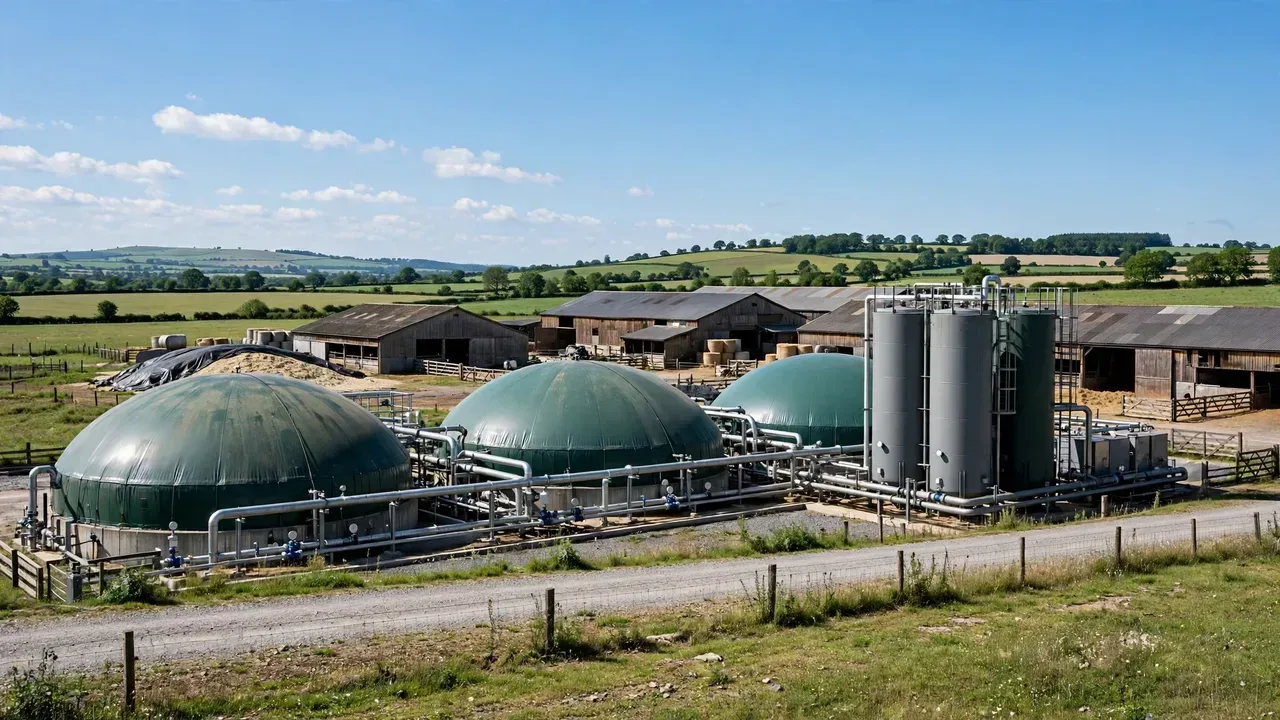
Biggest agricultural Carbon Footprint sources globally: enteric fermentation from ruminants (≈40% of ag emissions — cattle, sheep, goats produce methane during digestion), manure management (≈15% — methane from anaerobic storage, nitrous oxide from decomposition), synthetic fertilizer use (≈15% — nitrous oxide from soil after N application), rice cultivation (≈10% — methane from flooded paddies), and fuel/energy use (≈10%). In crop-only farms, fertilizer and fuel dominate. In livestock farms, enteric fermentation dominates. Reducing these: improve feed efficiency (less methane per kg product), anaerobic digesters for manure, precision fertilization, alternate wetting/drying for rice, renewable energy.
How can I reduce my farm's Carbon Footprint?
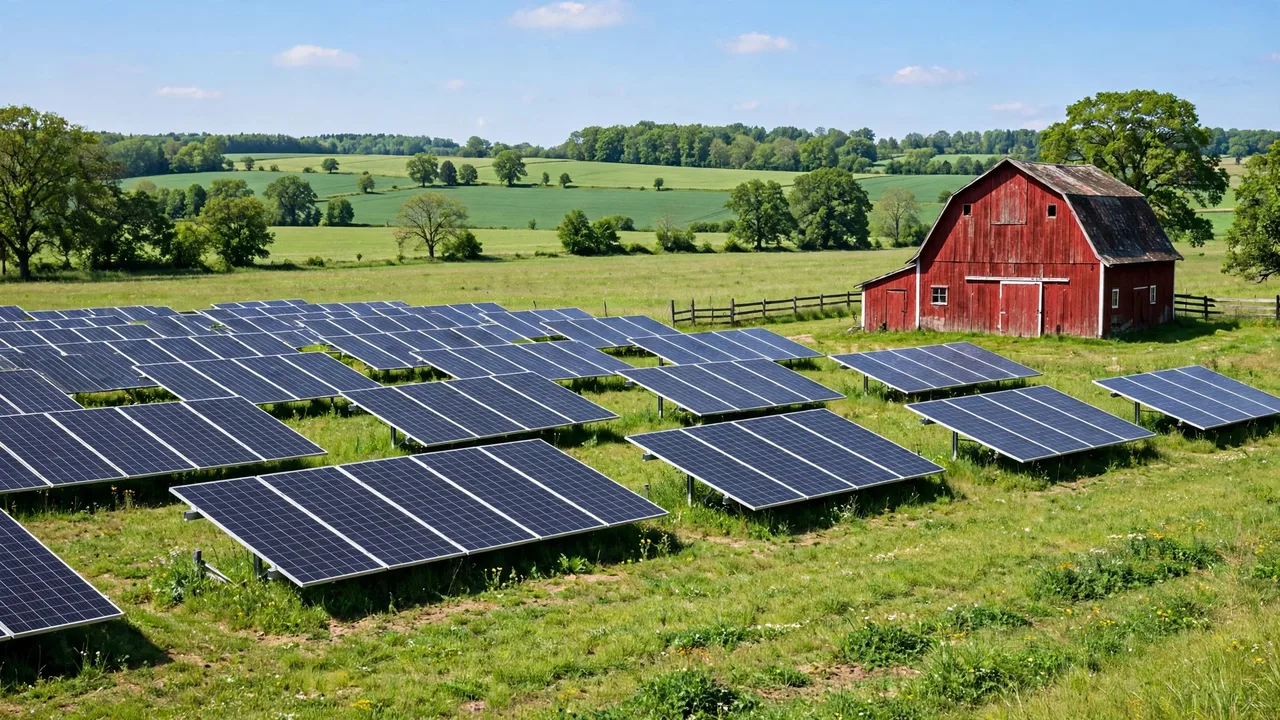
Reduce Carbon Footprint through: soil carbon sequestration (cover crops, no-till/reduced tillage, crop rotation — sequesters 0.2-2 t CO2e/ha/year), livestock management (improve feed efficiency, add 3-NOP or seaweed to reduce methane 20-80%, manure composting vs lagoon storage), nutrient management (split N applications, use inhibitors, soil testing to avoid over-application — reduces N2O), renewable energy (solar panels, biogas from manure, wind), energy efficiency (LED lighting, variable speed motors, insulation), and agroforestry (trees sequester 5-20 t CO2e/ha/year). Many reductions also save money — less fertilizer, less fuel, lower energy bills.
Can I earn carbon credits for Carbon Footprint reduction?
Yes, farmers can earn carbon credits through verified protocols: Verra VCS, Gold Standard, Climate Action Reserve, and USDA climate-smart programs. Common activities: no-till conversion (0.2-0.5 t CO2e/acre/year), cover cropping (0.2-1.0 t CO2e/acre/year), improved grazing management (0.5-2 t CO2e/acre/year), anaerobic digesters (large volume credits), afforestation/reforestation. Credit prices: $5-30/t CO2e (voluntary market), higher for verified additionality. Requirements: baseline measurement, third-party verification, permanence commitments (20-100 years), leakage monitoring. Transaction costs can be high for small farms — group aggregation through cooperatives reduces per-farm costs. Revenue is typically $5-50/acre/year.
How accurate are Carbon Footprint calculations?
Carbon Footprint calculations use IPCC emission factors which have uncertainty ranges: enteric fermentation ±20-30%, manure management ±30-50%, fertilizer N2O ±40-60%, fuel combustion ±5-10%. Tier 1 (default factors) is least accurate but simplest; Tier 2 (country/region-specific factors) improves accuracy; Tier 3 (farm-specific measurement, direct monitoring) is most accurate but expensive. For most farms, Tier 1-2 provides a reasonable estimate for tracking trends. Key accuracy tips: use actual fuel/fertilizer records rather than estimates, measure manure management system type, use local climate data. The goal is identifying major sources and tracking reductions over time, not laboratory precision.