Soil pH Amendment Calculator
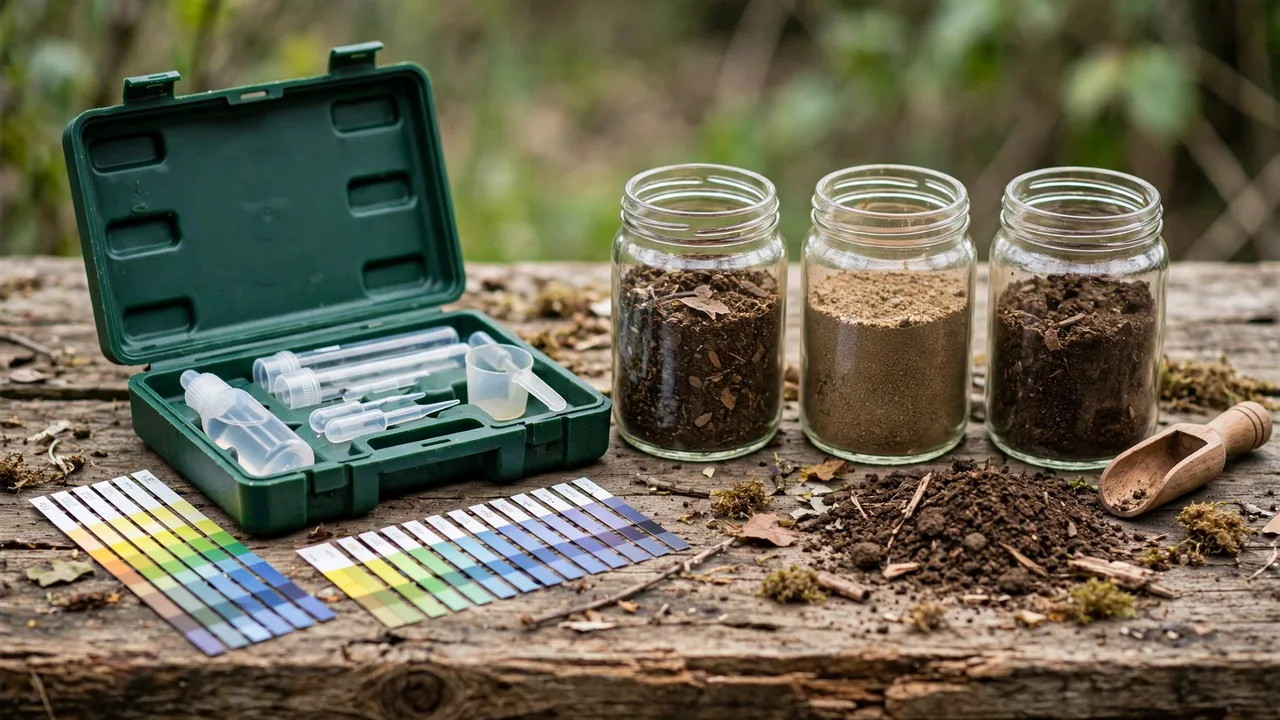
Calculate lime requirement for acidic soils or sulfur requirement for alkaline soils based on pH target and texture.
Results
How to Use This Calculator
Enter the required input values in the form fields above. Each field includes default values that you can adjust to match your specific situation. Click the Calculate button to see instant results. Use the Metric/Imperial toggle to switch between unit systems. Results are displayed in the results panel and can be used for farm planning and decision-making.
About This Tool
The Soil Ph is designed to help farmers, agronomists, and agricultural students make quick, accurate calculations for farm management. This tool uses standard agricultural formulas based on extension service recommendations and scientific literature. Whether you are planning inputs, estimating yields, or managing finances, this calculator provides reliable estimates to support your decisions.
Applicability: Applicable globally, with particular relevance for North American and European cropping systems. Adapt rates to your soil test results.
How the Calculation Works
This calculator uses established agricultural formulas to compute results from your input values. The calculation methodology follows standard practices recommended by agricultural extension services and research institutions. All formulas are transparent and can be verified against published agricultural literature. The calculator accounts for standard efficiency factors and loss rates where applicable. For precise site-specific recommendations, consult your local agricultural extension service or a qualified agronomist.
Real-World Example
A farmer uses this calculator to plan soil ph for their operation. By entering their specific field data, they receive instant calculations that help them make informed management decisions. The results allow them to compare different scenarios, optimize inputs, and estimate outcomes before committing resources. This saves time, reduces waste, and improves overall farm efficiency and profitability.
Common Mistakes & Tips
Common mistakes include using incorrect units (always verify metric vs imperial), entering estimated rather than measured data, ignoring local conditions and extension recommendations, and over-interpreting results (calculators provide estimates, not exact predictions). For best results: use accurate measured inputs, understand the formula assumptions, verify results against experience, consult local experts for critical decisions, and use scenario analysis to compare options before acting.
Reviewed by Agricalc Editorial Team — Agricultural engineers and agronomists with 10+ years of field experience. Our team verifies every calculator formula against peer-reviewed extension publications. For site-specific advice, consult your local agronomist.
References
- FAO — Soil Fertility Management for Sustainable Agriculture
- USDA NRCS — Soil Health Management Guide
- University of Minnesota Extension — Soil pH and Liming Guide
Frequently Asked Questions
How do I interpret soil test results for Soil Ph?
Interpreting soil test results for Soil Ph involves comparing measured values against established optimal ranges for your crops. Key parameters: pH (optimal 6.0-7.0 for most crops, 5.5-6.5 for potatoes/blueberries), organic matter (2-5% ideal for mineral soils), macronutrients (N, P, K — rated as Low/Medium/High/Very High), secondary nutrients (Ca, Mg, S), micronutrients (Fe, Mn, Zn, Cu, B, Mo), and cation exchange capacity (CEC — indicates soil fertility potential). Extension services provide interpretation guides with crop-specific recommendations. Always use a reputable lab and follow their sampling instructions for reliable results.
What is the optimal pH range for Soil Ph?
The optimal soil pH for Soil Ph depends on the crop: most vegetables and field crops prefer pH 6.0-7.0, potatoes prefer 5.0-5.5 (to suppress scab), blueberries and azaleas prefer 4.5-5.5, alfalfa prefers 6.5-7.5. Soil pH affects nutrient availability: at pH <5.5, aluminum and manganese become toxic while phosphorus, calcium, and magnesium become less available; at pH >7.5, iron, manganese, zinc, and boron become less available (causing chlorosis). Regular soil testing every 2-3 years monitors pH trends and guides liming or acidification decisions.
How does soil texture affect Soil Ph?
Soil texture (proportion of sand, silt, clay) affects Soil Ph through: water-holding capacity (sand holds 50-100 mm/m, loam 150-200 mm/m, clay 150-250 mm/m), nutrient retention (clay has high CEC and retains more nutrients, sand has low CEC and nutrients leach easily), drainage (sand drains quickly, clay drains slowly), aeration (sand has good aeration, clay may be poorly aerated when wet), and tilth/workability (loam has ideal structure for planting). Texture also affects amendment rates: sandy soils need less lime but more frequent fertilizer applications; clay soils need more lime but retain nutrients longer.
What organic matter level is ideal for Soil Ph?
Ideal soil organic matter (SOM) levels for Soil Ph are 2-5% for most mineral agricultural soils. Soils with <1% SOM are degraded and benefit from organic amendments. SOM improves: soil structure and aggregation, water-holding capacity (each 1% SOM increases water holding by ~15,000 L/ha), nutrient retention and supply (SOM contains 5-6% N and releases nutrients slowly), cation exchange capacity, biological activity (earthworms, beneficial microbes), and erosion resistance. Increase SOM through: cover cropping, crop rotation with perennials, manure/compost application, reduced tillage, and returning crop residues. Building 1% SOM typically takes 3-5 years of consistent management.
How often should I soil test for Soil Ph?
Soil testing frequency for Soil Ph depends on crop type and management intensity: annual field crops — every 2-3 years; high-value vegetable/fruit crops — every 1-2 years; greenhouse/nursery — every 6-12 months; after major amendments (lime, manure, compost) — retest after 6-12 months to evaluate effect. Always sample at the same time of year for consistent comparisons. Sample depth: 0-15 cm for routine testing, 0-60 cm for nitrate profiling, 0-30 cm for orchards. Collect 15-20 cores per field/management zone, mix thoroughly, and submit 500 g to a reputable lab. Proper sampling ensures accurate recommendations.