Orchard Spacing Calculator
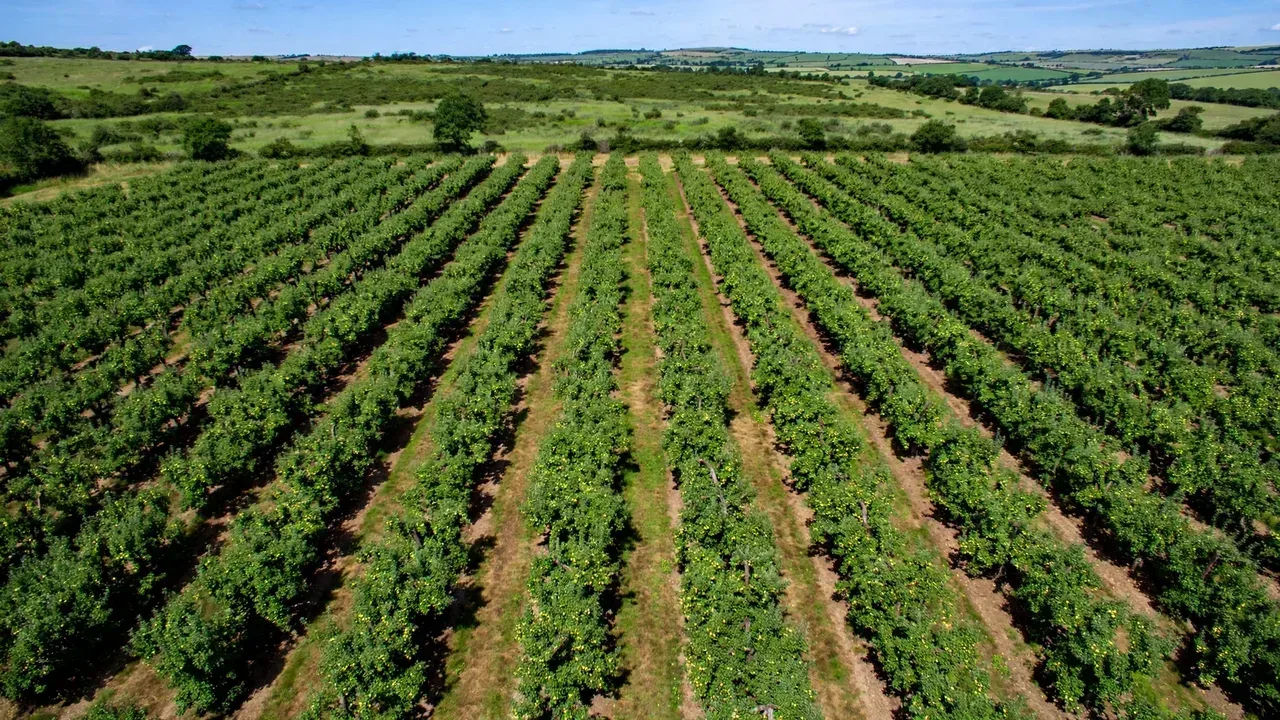
Calculate optimal tree spacing, trees per hectare, and total seedling requirement forchard planning.
Results
How to Use This Calculator
Enter the required input values in the form fields above. Each field includes default values that you can adjust to match your specific situation. Click the Calculate button to see instant results. Use the Metric/Imperial toggle to switch between unit systems. Results are displayed in the results panel and can be used for farm planning and decision-making.
About This Tool
The Orchard Spacing is designed to help farmers, agronomists, and agricultural students make quick, accurate calculations for farm management. This tool uses standard agricultural formulas based on extension service recommendations and scientific literature. Whether you are planning inputs, estimating yields, or managing finances, this calculator provides reliable estimates to support your decisions.
Applicability: Applicable to major field crops (corn, soybeans, wheat) in North America and Europe, adaptable worldwide.
How the Calculation Works
This calculator uses established agricultural formulas to compute results from your input values. The calculation methodology follows standard practices recommended by agricultural extension services and research institutions. All formulas are transparent and can be verified against published agricultural literature. The calculator accounts for standard efficiency factors and loss rates where applicable. For precise site-specific recommendations, consult your local agricultural extension service or a qualified agronomist.
Real-World Example
A farmer uses this calculator to plan orchard spacing for their operation. By entering their specific field data, they receive instant calculations that help them make informed management decisions. The results allow them to compare different scenarios, optimize inputs, and estimate outcomes before committing resources. This saves time, reduces waste, and improves overall farm efficiency and profitability.
Common Mistakes & Tips
Common mistakes include using incorrect units (always verify metric vs imperial), entering estimated rather than measured data, ignoring local conditions and extension recommendations, and over-interpreting results (calculators provide estimates, not exact predictions). For best results: use accurate measured inputs, understand the formula assumptions, verify results against experience, consult local experts for critical decisions, and use scenario analysis to compare options before acting.
Reviewed by Agricalc Editorial Team — Agricultural engineers and agronomists with 10+ years of field experience. Our team verifies every calculator formula against peer-reviewed extension publications. For site-specific advice, consult your local agronomist.
References
- FAO — Seed Quality and Planting Material Guidelines
- USDA — Seed Germination and Planting Rates Guide
- University of Minnesota Extension — Planting Rates and Seed Selection
Frequently Asked Questions
How do I calculate the correct Orchard Spacing rate?
To calculate the correct Orchard Spacing rate: (1) Determine desired plant population (plants/ha or plants/acre) for your crop and conditions, (2) Account for germination percentage (from seed tag or test), (3) Account for expected field emergence (typically 80-95% of germination), (4) Calculate seed weight needed using thousand-kernel weight (TKW) or seeds per kg, (5) Formula: Seeding rate (kg/ha) = (Desired population × TKW) ÷ (Germination % × Field emergence % × 100). For example: wheat target 300 plants/m², TKW 40 g, germination 95%, emergence 90% → rate = (300 × 40) ÷ (0.95 × 0.90 × 100) = 140 kg/ha.
What is the ideal plant population for Orchard Spacing?
Ideal plant populations for Orchard Spacing depend on crop, soil fertility, moisture availability, and planting date. Common ranges: corn 60,000-90,000 plants/ha (higher for irrigated, lower for dryland), wheat 250-400 plants/m², soybeans 300,500-500,000 plants/ha, rice 100-200 plants/m² (transplanted) or 300-500 (direct-seeded), cotton 80,000-120,000 plants/ha, sunflower 40,000-70,000 plants/ha. Too high a population causes intraspecific competition, lodging, and reduced individual plant yield; too low wastes resources and reduces total yield. Local extension recommendations provide crop- and region-specific guidance.
How does row spacing affect Orchard Spacing?
Row spacing affects Orchard Spacing through: light interception (narrower rows achieve canopy closure faster, intercepting more sunlight and reducing weed competition), water use efficiency, airflow and disease pressure (wider rows improve airflow, reducing fungal diseases), machinery compatibility (row spacing must match planter, cultivator, and harvester equipment), and planting density. Common spacings: corn 70-76 cm (conventional) or 38-51 cm (narrow), wheat 15-20 cm (drill) or 30 cm (row), soybeans 19-38 cm (narrow) or 76 cm (row). Narrow rows generally increase yield by 5-15% in favorable conditions but may increase disease risk in humid climates.
What seed quality factors matter for Orchard Spacing?
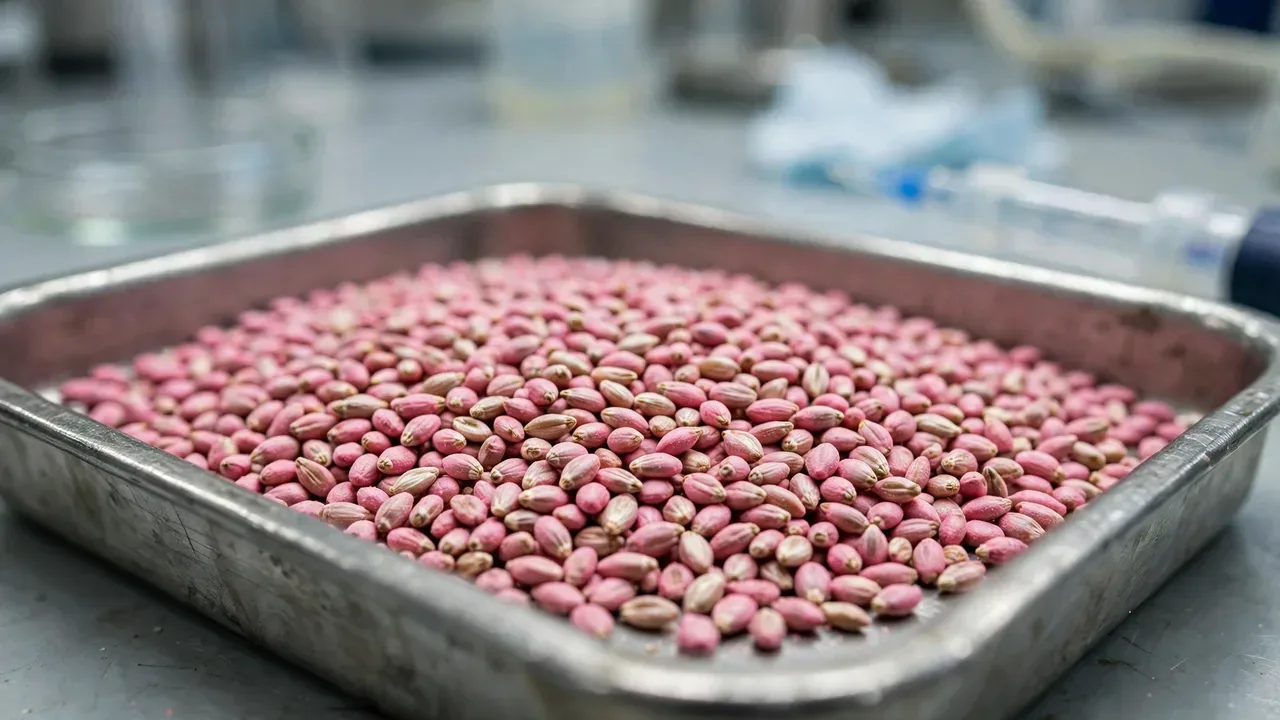
Key seed quality factors for Orchard Spacing: germination percentage (minimum standards: 85% for most field crops, 90% for vegetables, 75% for some grasses), purity (percentage of pure seed vs inert matter and other crop/weed seeds — minimum 95-98%), vigor (ability to germinate under stress conditions — tested via cold test, accelerated aging), seed health (freedom from seed-borne diseases), moisture content (12-13% for safe storage of most grains), and genetic purity (for hybrid and variety seed). Always purchase certified seed with a current seed tag showing test results. High-quality seed ensures uniform emergence and optimal plant stands.
How do I calibrate my seeder for Orchard Spacing?
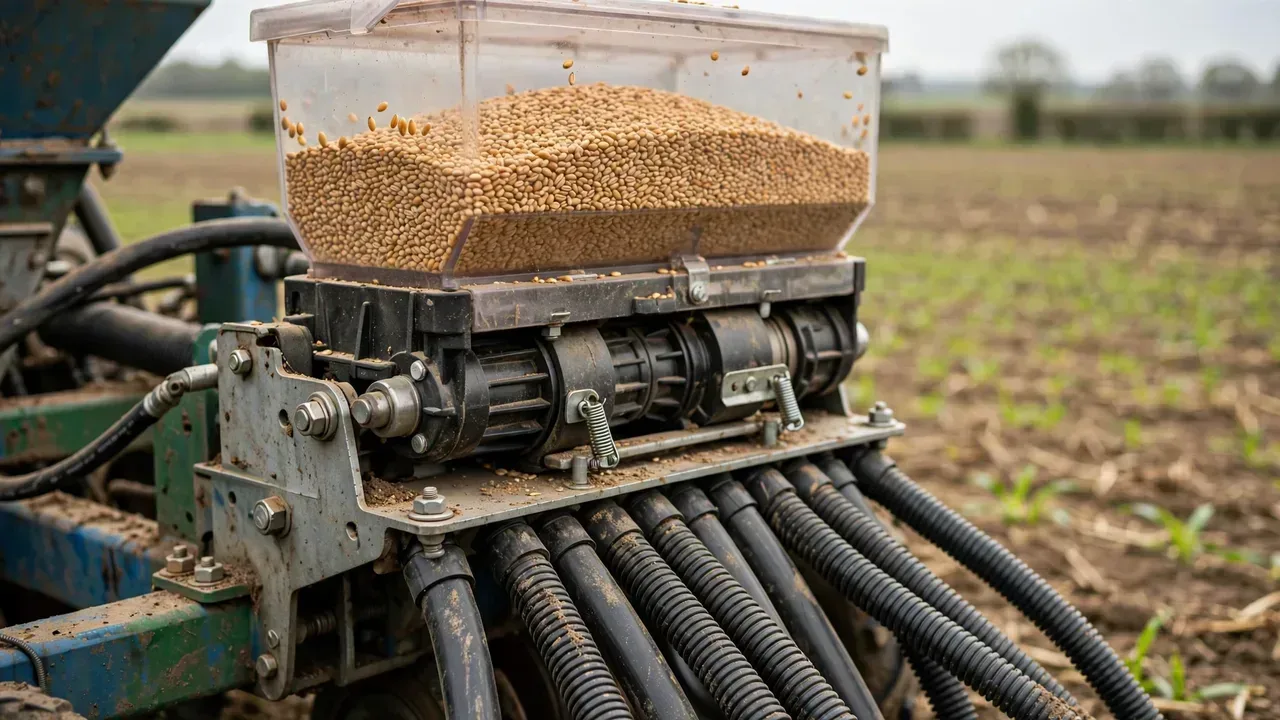
To calibrate your seeder for Orchard Spacing: (1) Determine target seeding rate (kg/ha or seeds/m), (2) Consult seeder manual for initial setting based on seed size and rate, (3) Fill seed hopper with the actual seed to be planted, (4) Drive a measured distance (e.g., 50 m) at normal planting speed with seeder operating, (5) Collect and weigh seed from a known number of rows or units, (6) Calculate actual seeding rate: Rate (kg/ha) = (Seed weight collected × 10,000) ÷ (Distance × row spacing × number of rows), (7) Adjust seeder setting up or down and repeat until rate matches target within ±5%. Recalibrate when changing seed lots, varieties, or rates. Proper calibration ensures accurate plant populations and avoids costly over- or under-seeding.